
The Spread That Doesn't Lie
The high yield index is telling you nothing is wrong. The surface is lying to you.

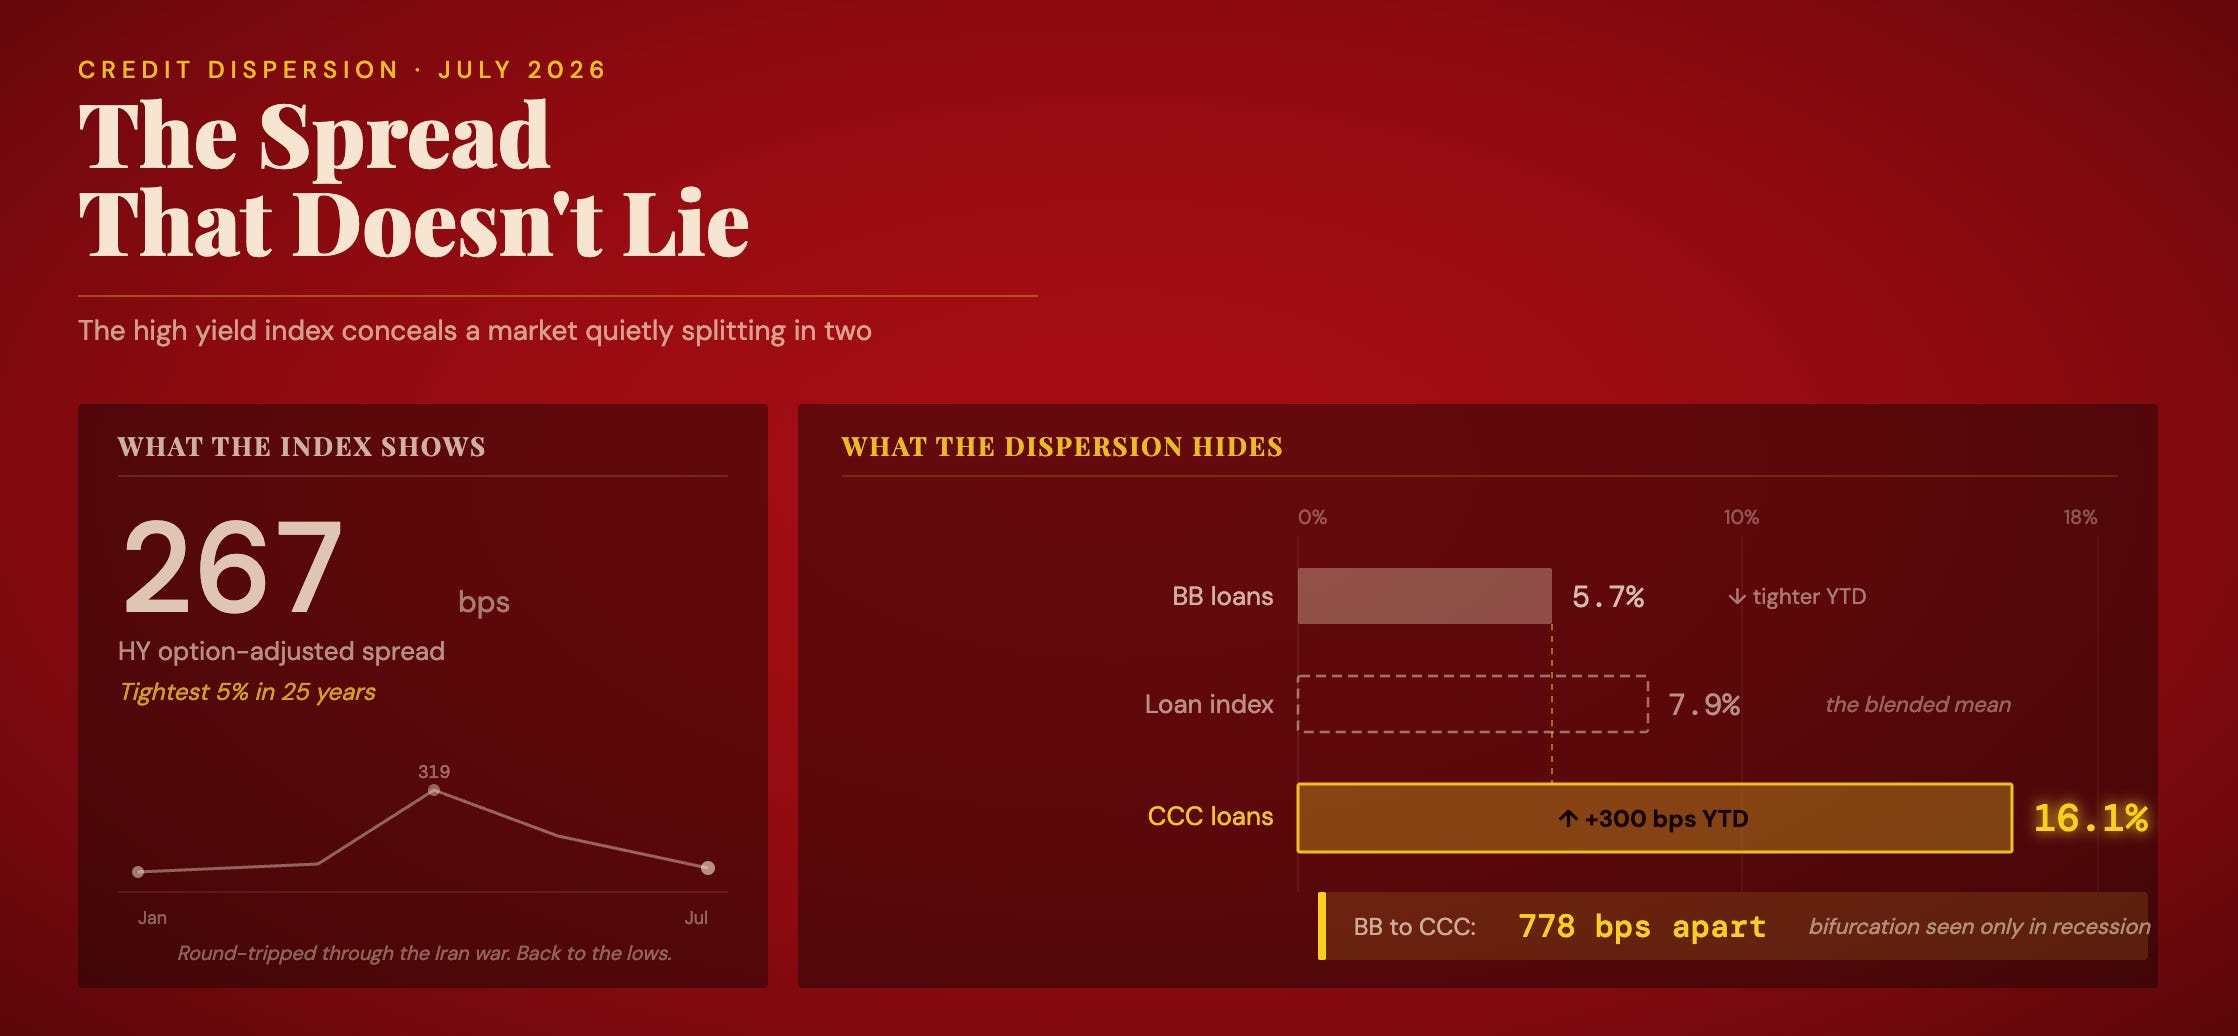
The high yield index is telling you nothing is wrong. As of mid July, the ICE BofA US High Yield option-adjusted spread sits at approximately 267 basis points, inside the tightest 5% of readings over the past twenty-five years. Investment grade is at roughly 80 basis points, BBB near 100, both close to their tightest levels in a generation. The spread widened during the Iran war, touched 319 basis points in late March, and has since round-tripped all the way back to the lows. Equities did the same. On the surface, credit and equity are telling an identical story: the war was transitory, the shock has cleared, carry is king, relax.
The surface is lying to you. Not because the number is wrong, but because it is an average, and this particular average is concealing the single most important thing happening in credit markets right now.
The Average That Conceals
A high yield index spread is a market-capitalization-weighted mean. It takes every bond in the universe, weights each by the size of its issue, and produces one number. That number is useful in a market where credits move together. It is actively misleading in a market where they don’t. And right now, they don’t.
The lazy call on credit has been the same for two years: spreads are tight, so they have to widen. Like a stopped clock, it will be right eventually, and it has been worthless in the meantime, because tight spreads can persist for years without a catalyst. Anyone who shorted credit on valuation alone has been run over repeatedly. That is the trap the bears keep walking into, and it is why the level of the index is the wrong thing to watch.
The signal is not the level. It is the shape. And the shape of the high yield market has quietly assumed the geometry of a recession while the index has not moved. Beneath a placid headline, the distribution has gone bimodal: a large, healthy majority financing itself at historically tight spreads, and a growing tail of stressed credits trading at levels the index never shows you, because in cap-weighted terms the healthy bulk drowns out the distressed minority. The mean sits still, the variance is exploding. We find that variance, not the mean, is where the information is.
The Spread That Doesn’t Lie
Here is what the average hides: so far this year, CCC-rated loan spreads have widened by more than 300 basis points. Over the same period, BB-rated loan spreads have tightened. The senior loan index yields 7.9% in aggregate, but that aggregate is a fiction of blending: BB loans yield 5.7%, CCC loans yield 16.1%. The rating bands are not on the same curve. They are not in the same market.
The BB-to-CCC spread differential stands around 778 basis points, and dispersion in the high yield bond universe is the highest on record. This is the kind of aggressive bifurcation that normally appears only in a recession. It is appearing now, with the index at its tights.
This is the spread that doesn’t lie. The quality spread, the gap between what the market charges the strongest speculative credits and what it charges the weakest, cannot be smoothed by cap-weighting, because it is the measure of dispersion itself. When the market prices BBs tighter and CCCs 300 basis points wider in the same six months, it is making an unambiguous statement: the weakest borrowers cannot survive rates at these levels and will not be able to refinance through mainstream channels.
The buyer base for quality remains deep, led by CLOs reaching for paper they can hold. The buyer base for the tail has evaporated, so the tail gaps to distressed levels on the first sign of trouble. Two markets, one index.
The epicenter is software: a sector that spent a decade as the safest home for leveraged lending, on the theory that recurring revenue and asset-light models were nearly default-proof, has become the fastest-deteriorating corner of credit.
Software and IT services now account for over 40% of all distress in the senior loan market. Technology carries the largest single sector load of distressed debt, near $47 billion. The trigger is the market’s dawning fear that artificial intelligence can antiquate a software business model faster than its debt matures, which has forced a sharp reappraisal of the leverage multiples that defined software buyouts.
Oaktree’s Bob O’Leary called it the swiftest fall from grace of any sector he has seen. The point is not that software is uniquely doomed. The point is that the market is now discriminating, violently, between the credits it believes will survive the next three years and the ones it does not, and it is doing this while the index tells you everything is fine.
Why the Number You See Is Worse Than It Looks
Two forces make the dispersion more dangerous than the raw spreads suggest, and both are invisible in the headline.
The first is recovery.
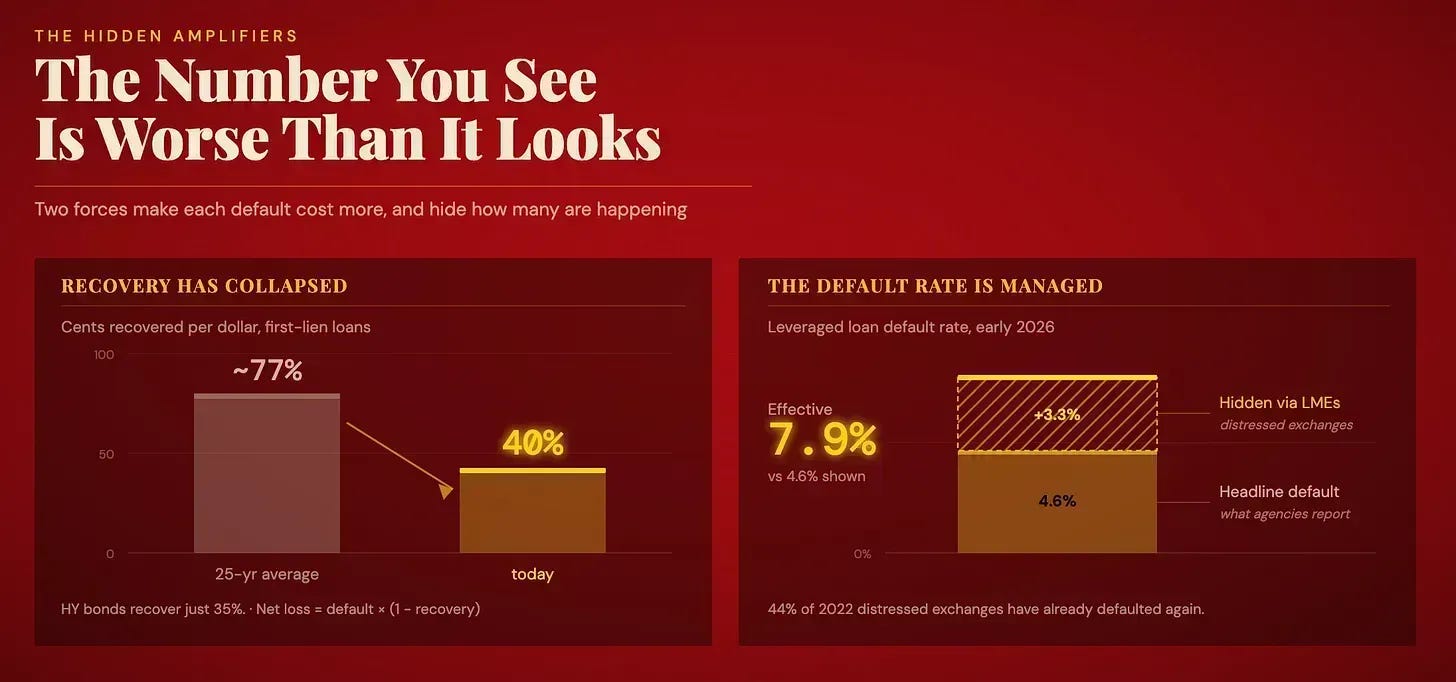
Net credit loss is not the default rate. It is the default rate multiplied by one minus the recovery rate, and the recovery side of that equation has quietly collapsed. First-lien loan recoveries are running around 40%, high yield bond recoveries near 35%. The twenty-five-year experience for first-lien paper sits in the high 70s. Recoveries have been cut roughly in half.
The reasons are structural: a decade of covenant erosion left creditors with weaker documentation and thinner protection, modern capital structures pile more debt into the first-lien layer with fewer junior cushions beneath it, and the rise of liability management exercises delivers worse outcomes than traditional bankruptcy.
The consequence is that a given default rate now produces far more realized loss than the same rate would have a decade ago. The dispersion is pricing this. The index level is not.
The second is that the default rate itself is a managed number.
The headline US speculative-grade default rate for 2025 was 4.6%, which reads as benign. But that figure counts only formal defaults. Include the liability management exercises, the distressed debt exchanges and uptier transactions that technically avoid a default event while imposing losses on lenders, and the effective leveraged loan default rate reached roughly 7.9% by early 2026. Carlyle’s Lauren Basmadjian put it directly: dispersion is rising, and headline default rates are masking real distress through these exercises.
The masking compounds, because these are not clean resolutions. Of the loans that underwent liability management exercises in 2022, roughly 44% have since defaulted again.
The distressed exchange does not cure the credit. It postpones the recognition, resets the clock, and leaves a thinner equity cushion for the next failure. The contained-default narrative that supports the tight index is itself an artifact of how defaults are counted.
So the honest reading of the market is that the index says 267 basis points and late-cycle calm. The dispersion says the weakest third of the speculative universe is already being priced for failure. The recovery data says each of those failures will cost nearly twice what it used to. And the default statistics say the failure rate is already half again higher than the headline admits. None of that is in the number equity investors are watching.The Last Honest Price
There is one more layer of concealment, and it is the one that matters most for how this ends.
The sub-investment-grade credit universe now stands near $6 trillion, split roughly in thirds between broadly syndicated loans, high yield bonds, and private credit. The first two mark to market every day. They are where the dispersion we have described is visible, because a public bond or a syndicated loan has a price, and that price moves when a buyer demands more spread. Private credit does not mark to market. A direct lending fund holds its loans at a valuation the manager assigns, and that valuation, by design and by incentive, moves slowly and rarely downward. This is the argument we made in full in There Is No Private Credit: the asset class markets its stability, but that stability is a reporting convention, not an economic fact. The smoothness is the absence of a price, not the absence of risk.

Which means the public dispersion is the marked-to-market shadow of what private credit is holding at par. The same software buyouts that trade at CCC levels in the syndicated market, at spreads north of 1,500 basis points in the deepest part of the tail, sit inside private credit portfolios carried at or near cost.
The gap between those two marks is unrealized loss that has not yet been recognized. And the tells are already leaking through the reporting convention. The private credit industry default rate has climbed to 5.8% and is forecast toward 7 to 8%.
“Bad PIK,” the practice of converting cash interest to payment-in-kind that serves as a proxy for hidden distress, has risen to 6.4% of borrowers from 2.5% at the end of 2021. Business development companies trade at roughly a 22% discount to net asset value, a level last seen during the COVID shock, which is the public market’s way of telling you it does not believe the private marks. And retail investors are voting with redemptions, roughly $21 billion of withdrawal requests in the first quarter alone, with major platforms gating or capping and meeting only about half. When a vehicle has to gate, the mark and the exit price have diverged. That divergence is the spread private credit does not print.
Now assemble the timing
Credit dispersion is not a coincident signal with equities. It leads. High yield spreads have historically widened four to eight months before a recession begins, and the deterioration phase, the period when CCCs blow out while the index holds and the strongest credits stay tight, can run six to eighteen months before equity markets react.
The mechanism is structural: credit dealers reprice the tail before equity volatility-targeting strategies register anything, so the credit market moves first by construction. This is why the divergence everyone is misreading, dispersion widening while equities sit near highs, is not a contradiction waiting to be resolved by credit catching up to stocks. It is stocks lagging credit. The signal has already fired. The equity market has not yet listened.
The catalyst is not hypothetical, and it is on a schedule. Roughly $1.35 trillion of non-financial high yield debt matures in 2026, with another $1.2 trillion of leveraged debt maturing between 2027 and 2029. The bottom decile of that stack cannot access the primary market at any rational cost. A CCC spread of 16% is not a price, it is a closed door, and the door does not reopen while the Federal Reserve holds at 3.50 to 3.75% with no cut coming. As we argued in The Fed Is Not Coming Back, the market’s expectation that Warsh pivots and refinancing conditions ease is itself the mistake.

The refinancing pressure driving the bifurcation does not relent, because the rate environment that created it is structural, not cyclical. The dispersion is the leading edge of a refinancing failure that the index will register only when the tail defaults in size and the cap-weighted mean is finally forced to move. By then equities will have already turned, because credit turned first, months earlier, in a spread nobody was watching.
The conclusion is not that the index is high or low. It is that the index is the wrong instrument. The risk in credit today does not live in the level of the headline spread. It lives in the assumption that the headline spread is the signal.
The dispersion is the last honest price in a market where the index has gone quiet and the private marks have gone silent, and it has been telling the truth for six months. The question worth sitting with is not whether spreads are tight. It is why, if everything is fine, the market is already pricing a third of the speculative universe for a recession it claims is not coming.
This connects to our capital-cycle argument in Architecture of the Next Cycle: the misallocation is never visible in the aggregate at the moment it matters. It is visible only in the dispersion, and only to those who stop reading the mean.

Normandie Research is an independent publication producing strategic analysis at the intersection of geopolitics, economic statecraft, capital flows, and financial markets. This analysis is provided for informational purposes only and does not constitute investment advice or a solicitation to buy or sell any financial instrument. Readers should conduct their own due diligence and consult qualified financial advisers before making any investment decision.